Using NCEP/NCAR data for May, at the surface temperatures have been amongst the warmest since the data started in 1948, however they were within the range of temperatures for recent years.

Aloft temperatures were even higher, the second warmest on record

The warming is associated with mass influx of warmer air, particularly over the North Pacific, this is shown in the following large graphic.
The following graphic has three panes, the upper is air temperature anomaly with height, over which is superimposed meridional flow, both are for the band 60 to 65degN. The meridional flow is shown in black overlay, northwards flow is labelled N, southwards is labelled S, I dislike the terms northerly and southerly as they're confusing, but a northwards flow is a southerly wind (i.e. wind from the south) and vice versa.

This pattern of meridional flow is similar to the climatology, which is shown below. This is not a surprise as the fixed land/ocean pattern fixes the pattern

However referring to the three paned image above, the correlation of Nino 3.4 is shown below. From this it seems that the pattern of strong northwards flow over the Baltic and Alaska is associated with the El Nino.
The El Nino is fading, however it will be later this year before a La Nina sets in and the impact on global average temperature and Arctic temperature will likely persist over the coming summer.
So what effect has this had on sea ice during May?
PIOMAS gridded data is now out, I have used the PIOMAS HiDay gridded files of grid box effective thickness to calculate the volumes for all regions on days 121 and 151 (approximately the start and end of May). This allows an initial indication of the first part of the spring volume loss. Once June's data is in I will look at this in more detail, but for now I look at May volume loss.
The sectors are:
- Pacific: Okhotsk & Bering Seas.
- Peripheral: Beaufort, Chukchi, East Siberian, Laptev Seas.
- Atlantic: Kara, Barents, Greenland Seas.
- Central Arctic: Central Arctic & Canadian Arctic Archipelago.
- Canadian: Baffin Bay & Hudson Bay (Gulf of St Lawrence does not feature in PIOMAS).
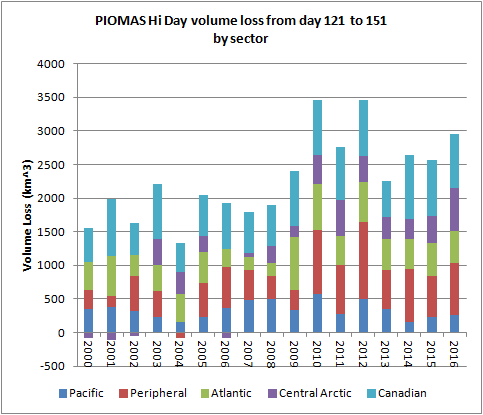
The above graph shows the overall increase in May volume loss, but it isn't very clear, so I have recalculated that data as differences from the average for each sector from 1980 to 2016.

What interests me are the large losses in 2010 and 2012. 2010 was a large volume loss year, but remnant ice in the East Siberian Sea kept September extent from falling to very low levels, whilst 2012 was a substantial new record. Comparing 2016 to those years shows that May 2016 volume loss in the Peripheral Seas was far from as severe as in 2010 and 2012, this might prove significant as a factor for the coming summer because over winter thickening in the East Siberian Sea and Laptev has been quite normal for recent years, and in May Laptev saw a marginal net gain in volume. This suggests ice is entering the summer proper in those regions is in rather a healthy state similar to recent years.
Indeed only Chukhi has seen greater May losses than in May 2012. It might seem strange that Beaufort has lost less than in May 2012 but the massive loss of extent over May has come from the the loss of very thin ice in a poor state caused by wind driven divergence over winter (export towards Chukchi).
Over May Beaufort extent has collapsed very early, which has been due to wind driven export.

The slight recent levelling may be the start of a reduced rate of loss due to the presence of multi-year ice, I recently suggested may be about to start. However my attitude to this is simply to watch and see what happens, I don't know if this is just a minor pause, or the start of a change of loss rate.
The recent sensor failure has stopped me from using sea ice data based on that system, so I have had to resort to the shorter AMSR2 dataset. This poses a problem for assessing long term significance. So the following graph for Beaufort combines both datasets and shows extent for a seven day average centred on 1 June.

Clearly Beaufort has more open water than any time in the record at the start of June.
However Beaufort is a relatively small part of the peripheral seas and it is in those seas at the coastal edges of the Arctic Ocean that the serious melt will start to happen through June. Conditions in those seas set the scene for the coming summer.
Overall extent falls in the peripheral seas is not exceptionally unusual.

Extent really tells us about the ice edge, what is the ice state behind the ice edge in the peripheral seas?
Compactness is the ratio of sea ice area and sea ice extent (explained here), it gives an indication of how compact the ice is behind the ice edge. Compactness falls during the summer as floes melt and open water between them increases, current compactness isn't exceptional in the peripheral seas (nor indeed in Beaufort itself).

And that slight drop recently in the 2016 drop probably isn't significant. Again I have calculated the 1 June centred seven day average, this time for Peripheral Seas compactness. Here AMSR2 has had to be scaled to match the overlapping three days. But compactness in the Peripheral Seas doesn't seem to be doing anything really surprising.The situation at the end of June might be different.

Overall extent remains low.

However this is mainly due to low sea ice in the Pacific and Atlantic regions.
In the Arctic Ocean the effect of the Pacific Ocean extent is left out.

Extent tracks below recent years, and comparing AMSR2 and NSIDC Extent is likely to be at record low levels.

Beaufort is one factor here, but the Atlantic ice edge plays a role. The Central Arctic is already showing a very early drop in extent as the ice edge has been moved polewards of Svalbard by what seems to be Atlantic Ocean warmth.
Going back to the difference from 2012 in volume, the overall pattern is that from the Siberian coast to Canada there is a central band of ice that is in a reasonable condition similar to other recent years, however Chukchi and Beaufort provide an avenue of warmth from ocean warming due to open water and the ice/ocean albedo feedback.

I am not convinced the Atlantic ice edge has much bearing on extent within the Arctic Ocean Basin, the trend of ice loss in Barents is far steeper than in the Arctic Ocean Basin's seas, it does not seem to be a particularly 'infectious' trend.
Overall volume is similar to other recent post 2010 years, but is below May 2015. For completeness below is the May volume for all regions.

How much is the Central Arctic keeping overall volume up? Below I have calculated the total May volume, for both Central Arctic and the Total volume minus Central Arctic.

Remove the Central Arctic from the equation and volume is the lowest on record, but not by a large margin.
A new record is possible this year, but from my reading of all the data it is far from certain. With poor melt weather we could yet again see an increase in September volume on last year. The El Nino is still having a substantial impact on the atmosphere, what impact this will have on the creation of an Arctic Dipole?

The pressure patterns that drive the Arctic Dipole are shown above. Winds from the high pressure over Greenland and the Canadian side of the Arctic Ocean act together with low pressure dominance over the Siberian side and drive a flow that draws in warm winds and Pacific water. This pattern has dominated summers since 2007 and has played a role in low extents since that year.
In general a good melt weather pattern in the summer is clear skies over much of the ice through June and August, but storms and cloudy skies in August. The early summer clear skies let the sun shine on the ice, then later in the summer as the sun is getting low and the energy from it declines, clouds trap infra-red emitted from the ice and ocean, radiating it back to the surface. Storms in the late summer can disrupt the ice pack and mix warm water from the surface under the pack causing more melt.
The winds that have so damaged Beaufort have blown along the Alaskan coast towards Siberia. Ekman Transport would cause the movement of the ocean column (where there is open ocean) and the surface ice to be towards the right of the wind direction. In other words northwards. Has this drawn warmer Pacific waters in through the Bering Strait? If it persists, will it drive water warmed by the sun under the ice causing enhanced melt?
There is a lot of uncertainty, but it is possible that we will see September extent approaching that of 2012, possibly beating 2012, either outcome will need the weather to be conducive to melt over the coming summer.
23 comments:
Thanks for an informative post. In your definitions of regions, I think you meant Barents rather than Bering in the Atlantic.
Thanks for catching that Ron, corrected now.
re: "... the trend of ice loss in Barents is far steeper than in the Arctic Ocean Basin's seas, it does not seem to be a particularly 'infectious' trend." That looks like the right reading of the full data series. This year, though, my impression is that excess heat in Barents has contributed to early ice loss in the western Kara. Again, not necessarily 'infectious', but as Kara opens up further in the coming week, it adds its bit to the heat budget of the Arctic (and to the land/ocean, snow/ice interplay).
Hey Chris,
It's refreshing to discuss things on a forum where the people aren't doomers. Sam, D, and Andy Robinson on Neven's being good examples. I find this place to be one of the few reasonable places to discuss the Arctic without encountering crackpot predictions.
Thanks for a great post, Chris. Very stimulating. It was difficult to find something I disagree with, but here goes.
A new record is possible this year, but from my reading of all the data it is far from certain. With poor melt weather we could yet again see an increase in September volume on last year.
I believe it will take extremely poor melt weather for this year to end up above 2015 volume-wise. Why? Because there seems to be so much more heat in the system this year.
As for breaking the 2012 sea ice extent record, I'm agnostic just like you. There will definitely have to be periods you describe (sunny weather, high temps) for it to be possible, but here's a short list describing what factors each year has to bolster it's championship aspirations:
2012
- Exceptionally good melt weather the first half of June, perhaps the best there has ever been (in the record)
- Some more good melt weather during July
- Huge volume drops during May and June
- Very low compactness
- GAC during August
2015
- Warmest winter on record
- Extremely early opening of Beaufort Sea where a lot of MYI is
- Even more MYI positioned right in front of Fram Strait, quite a bit of transport so far due to Beaufort Gyre
- Lowest snow cover on record for extended periods (Northern Hemisphere will be virtually snow-free - except for CAA and Greenland, of course - by next week, probably earliest on record)
- Lowest volume on record as of end of May
- Lowest volume outside of the CAB, where the ice is easier to melt
- A lot of thicker ice supposedly along the Siberian coast, that is under quite an intense heat wave as we speak (melt ponding, preconditioning)
- Compactness relatively low right now, due to melt ponding and dispersion into Atlantic and Beaufort Sea, possibly meaning more melting momentum during July and August
- Warm Atlantic (we don't know how warm, not enough real-time data)
So, anything is possible, but judging from this snapshot, the odds seem to be in 2016's favour, although its massive sea ice extent lead over 2012 is probably going to be slashed in the next 10 days.
It'll be exciting to see what happens after that. And hopefully not too depressing. Mixed feelings as always.
In the list of factors, 2015 should read 2016, of course.
Neven,
What is with you? You can't even tolerate opposing viewpoints on your own site. Sam comes along and makes these wild predictions, and you ban someone when they challenge him on it. That stinks of hypocrisy
Why don't you ask over on the ASIB or forum, instead of polluting a comment section on another blog? Show the host some courtesy.
Because I consider Chris a friend who actually listens to what I have to say instead of siding with people like Sam who make off-kilter predictions and could be considered trolls. You don't show courtesy to anyone who has a different view from what I've seen. Besides, your forum is overrun by people who grossly exaggerate scientific studies to make their own wild claims. AbruptSLR and the methane thread is an excellent example. Some on Fractal Planet have noticed that as well. And the predictions of sea ice extent below 3 million km2 is simply not going to happen. Maybe it will break 2012, but that's a considerable "if" at the moment
Dreessen,
Do you find me running around attacking everything I don't agree with?
The first commenter on this thread is R Clutz, yes, that's Ron Clutz. I have a vague memory of being rather rude about his commentary on sea ice in the past (click his name you'll see his site). I've made my rather strident and dismissive views on climate change denial very public. But I don't feel the need to labour the point.
For what it's worth I don't think there is anything 'with' Neven, he's always struck me as a very reasonable chap. If doomers are allowed at the forum and his blog it's because he is very tolerant. PS, IIRC Neven isn't the only moderator at the forum. I have really pissed off a lot of people at the forum, I'm not banned, I just don't have the time now I'm in management at work.
Have you ever noticed how I leave the denialists alone? Have you ever wondered why I leave the doomers alone? It's because I am just not interested in arguing for arguments sake. Where there is an evidenced point to make I make it, if it interests me.
Trolling is setting up an argument with deliberate intent of sparking a fight, like a troll uses its bridge. I haven't seen you doing that. Flaming is deliberately creating antipathy, this is generally because of deficits in the individual concerned. I've seen you getting angry, I don't think you've been flaming.
But I have seen you 'sea lioning'.
You really don't have to fight every battle out there. Sometimes one needs to let the ongoing process attend to the argument.
Chris,
Yeah, I should take your advice. I just think Neven has been treating me with a double standard as opposed to someone like Sam.
Dreessen, are you BryantFinlay/Bryant Morganelli/Bryman/ArgonneForest/bobcobb?
Neven,
When 2013 hit it left me wondering whether the Arctic Dipole during summers of 2007 to 2012 was just a blip, and wouldn't return. GFS shows a similar situation as 2013 into June, high over Siberia, low over the pack. You may be right that temperatures could win over even poor weather. I'm not so confident.
I know that the idea of warming driving the sea ice loss is very fashionable at the moment. And yes warmth will affect sea ice. However I suspect the role may be at risk of being overstated and the causality may be rather mixed up.
Lawrence 2008 examines Rapid Ice Loss Events in GCM projections and finds that the loss of sea ice drives the warming events, not the other way round.
http://www.people.fas.harvard.edu/~moore3/Lawrenceetal2008.pdf
Paragraphs 7 & 8.
This is not to say that the current warmth won't have an effect. But claims of winter impact have proven generally ill informed and wildly overstated, neither Cryosat 2, nor PIOMAS supported the idea of a total collapse of winter growth (as some were saying would happen). And the worst impact (Beaufort) turned out to be wind, not temperature.
Waters in the Pacific are not generally warmer than average, there has been a cool patch on the Asian side and a warm tail up the western coast of North America. Which water will be drawn into the Arctic if a classic Arctic dipole develops?
We still don't know to what degree warmer Atlantic waters have been drawn under the pack.
If there is going to be a record low this year, my bet is we'll know by the end of this month, widespread low compactness seems to precede crashes - but without NSIDC Extent it's hard to see how we can quantify this.
It will be interesting to see the distribution of prediction in the SIPN for June.
My entry to SIPN aside, I'd bet on a place in the bottom three this September. But I do have a low side bias to my assessments this early in the summer.
Neven, your point?
Chris, I would say bottom three is a good bet. Based on how the NSIDC extent has been looking lately, it fits with your range.
Neven, your point?
Thanks for confirming.
My point is that if you post on blogs under 3-5 different names, without letting folks know you are one and the same person, you are misleading them. If you then also attack other commenters and provoke them, there's enough reason for a blogger to ban you (never mind whether he agrees with you or not). Especially if you suck up to the blogger, trying to get him to agree with you and denounce the opinions of those you disagree with (probably hoping they then get angry and leave the blog/forum).
I spent time and effort to calm down the situation that had arisen because you felt the need to attack a 'doomer' by twisting quotes of well-known scientists into your personal opinion. Another commenter, Susan Anderson, did the same, in good faith.
If I had known bobcobb was in fact you, BryantFinlay/Bryan Morganelli/Bryman/Argonneforest/Dreessen, I would have spared myself the time and energy (and Susan Anderson's). You may not be aware of it, but what you're doing can be described as trolling behaviour. And you're doing it here too.
That was my point.
Neven,
I merely cited links to make my point. I didn't twist their words.
So how is what I post on your blog any different from what Sam does? He trolls, and you do nothing about him. Whatever...
I'm not sucking up to Chris, and I criticize opinions that I feel are extreme, like Sam's, by providing evidence.
And this is his blog. He decides who's trolling, not you. If he wants me to leave, then I will do so.
Until then, have some decency and don't presume to know what my intentions are. I'm restraining myself to Dosbat and Fractal Planet. I've had enough of the other blogs. And with that, I'm done talking to you.
Chris,
I noticed you said you wanted to look at the NSIDC extent. Is this what you're looking for?: http://nsidc.org/arcticseaicenews/charctic-interactive-sea-ice-graph/
Dreessen,
No it's the NSIDC concentration upon which Wipneus's regional dataset is based and which I have used for various other calculations. Being able to use the same baseline for sea ice anomalies as for weather anomalies is a very powerful technique that often makes the factors fall out in a very simple and intuitive manner.
I am pondering updating and seeing if anything is salvageable from the data as it stands, it might be after July before we see the data start up again.
***
I am sorry to have to say this, I don't like to get personal, and I had hoped you wouldn't take advantage of my patience.
You are trying my patience by bringing your arguments over here, and by attacking Neven, who I have a great deal of respect for. I have known for a while that you have posted at Neven's Blog as Bryant Morganelli My suggestion is that you stick to your statement that you will voluntarily not engage with Neven's blog or the forum.
I would also ask you to reflect on the nature of dignity culture. That's my culture (conflations of guilt with that culture are poorly considered crap), I don't go looking for others to fight my battles, but by the same token; I don't like other people trying to get me to fight their battles.
You are still welcome here, as long as you keep engagement interesting and civil. But you might want to take a break to reflect on your behaviour and allow the feelings of others to cool.
Chris,
Alright. It's just that I get fed up with what I see as extreme opinions. I do tend to get carried away. I admit that. I just wish people wouldn't take things to extremes, saying thing like "the earth's better off without us". That's almost as bad as climate deniers. It gets very annoying to see that kind of talk when everyone should be trying to help alleviate climate change, which is why I go after those people with such vigor. I guess you could say I try to keep a Hayhoe type of optimism
You may be right that temperatures could win over even poor weather. I'm not so confident.
Nah, I don't think that temps are enough to break records (2012 was pretty anomalously warm too). I was just referring to your "an increase in September volume on last year". There is almost 2200 km3 less volume now compared to last year, and so it will take extremely poor weather for 2016 to end up above 2015 volume-wise (although 2015 did lose quite a bit of volume during July, which was extremely warm).
Air temperature is just one of many factors.
I know that the idea of warming driving the sea ice loss is very fashionable at the moment. And yes warmth will affect sea ice. However I suspect the role may be at risk of being overstated and the causality may be rather mixed up.
Lawrence 2008 examines Rapid Ice Loss Events in GCM projections and finds that the loss of sea ice drives the warming events, not the other way round.
Perhaps it's the chicken and not the egg, I don't know enough about these things. But that is irrelevant. It would then still be an indicator that there is a lot of ice loss, and that's what we're interested in.
If there is going to be a record low this year, my bet is we'll know by the end of this month,
I agree, if there is (below) average preconditioning through melt ponds -what I like to call 'melting momentum', we can say with a fairly high level of certainty that there won't be a new record this year. Unless there's a repeat of 2015 July temperatures, which showed the limits of this predictive tool last year.
Either way, I'm looking forward to it (if I forget about the potential consequences).
Dreessen,
I see several problems with Doomerism.
1) Pushing beyond what the evidence unambiguously shows opens one up to easy attack which can be used to discredit everyone.
2) It makes positions smear with the other internet wackos - like 2012 Doomers - end of the world didn't happen.
3) When believed, doomerism fosters a position of "what's the point anyway".
And on that point. When I've done a 12 hour day I'm often too tired to face the walk home, so I have a taxi driver I call. Recently we were in heavy traffic, he asked me what the point was in not having a car when virtually everyone else is driving. My reply was as follows: If everyone else had slaves I'd still not have a slave because slavery is wrong. He appreciated the point.
4) Actually, things are bad enough as they are anyway, factor in the time it will take to transition from carbon and things will get bad enough. There's no need to reach into a very uncertain future for cherry-picked horror stories.
And I am going to add a fifth.
5) Hollywood is entertainment, don't think that every disaster needs to be framed in the timescales and exciting explosions. Ooh - METHANE TIMEBOMB!!!!
Which would be the most catastrophic disease?
Airborn Ebola?
or
A variant of the flu that hits mild, spreads widely, and infects 80% of the population, then inflicts the majority of victims with dementia within the next three months.
Hollywood would chose Ebola, blood, horror, blue lights, emergency, yadda yadda. Hollywood would be wrong.
The airborn Ebola could be stopped by marshal law and food drops at people's houses for two weeks. The weight of millions of people with dementia could wreck society, even collapse a civilisation. The logical option, euthanasia, would wreak emotional scars on the survivors.
Doomers irritate me as much as denialists. Then some interesting idea hits me and I think "NMFP" and get on with my life. NMFP is of course a response that may be reserved for a single male in his 50s.
Neven,
Well, volume more than last might have been too much, but you get the underlying point.
I think it is going to be exciting. My expectation is low, but as I said this early in the summer I generally have a low bias. This year a low bias may be justified.
Chris,
That pretty much crystallized my entire argument right there. I don't know how familiar you are wrestling personalities, but the Undertaker had a quote I like to stress when it comes to climate change outcomes, "Sometimes it's hell getting to heaven." In other words, we're going to have a tough path, but I think civilization will be intact. Not sure what your opinion is on that, but that's mine.
Post a Comment